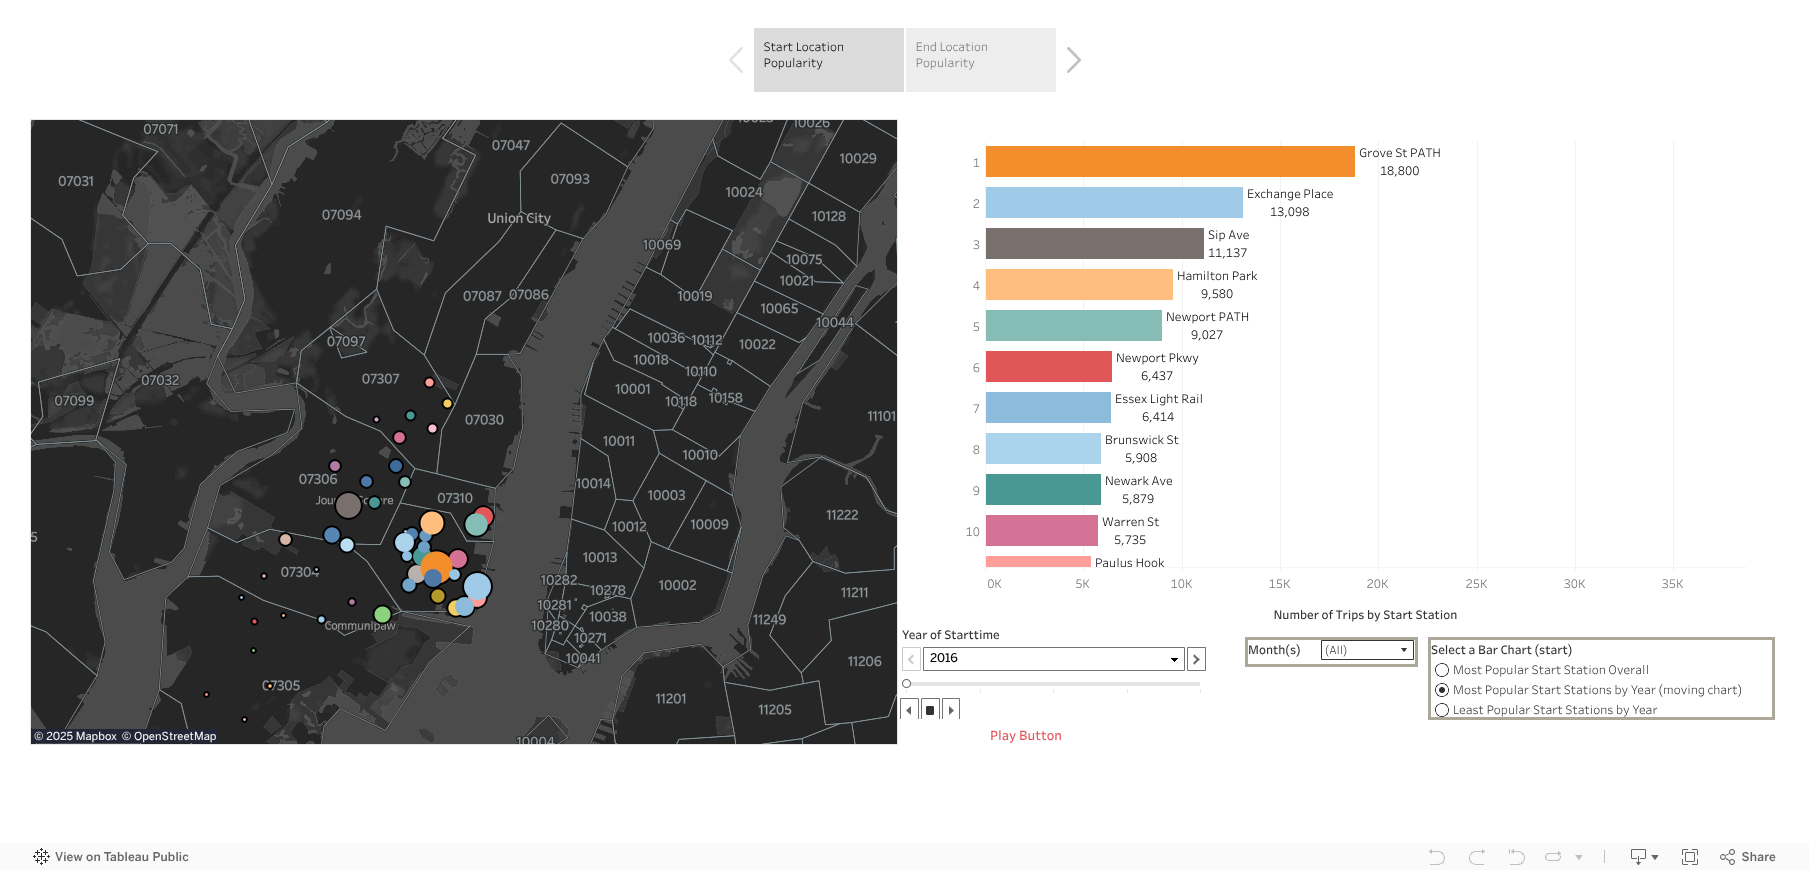
Station Location Questions:
- What are the most/least popular stations since 2016?
- Other trends?
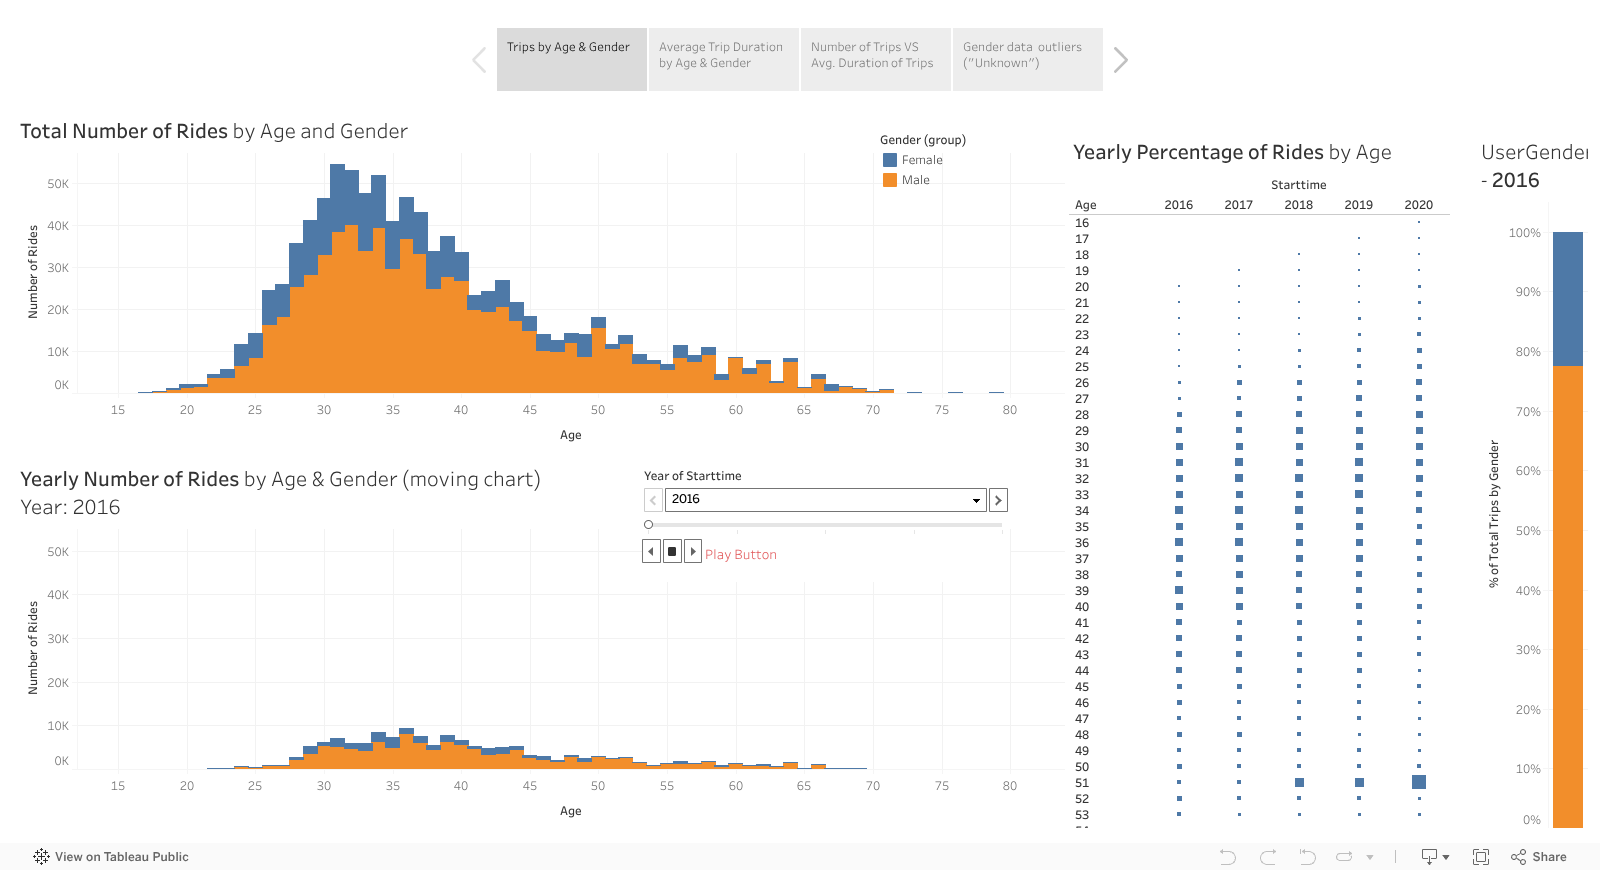
Number/Duration of Rides Questions:
- What age group has the largest number of total rides? Changing by year?
- What age group has the longest average ride time? Changing by year?
- Whats happening to number of rides vs average ride time?
- Other Trends?
User Type Questions:
- What proportion of riders are customers vs subscribers? Is this changing by year?
- What age groups are primarily subscribers or customers? Is this changing by year?
- Other Trends?
